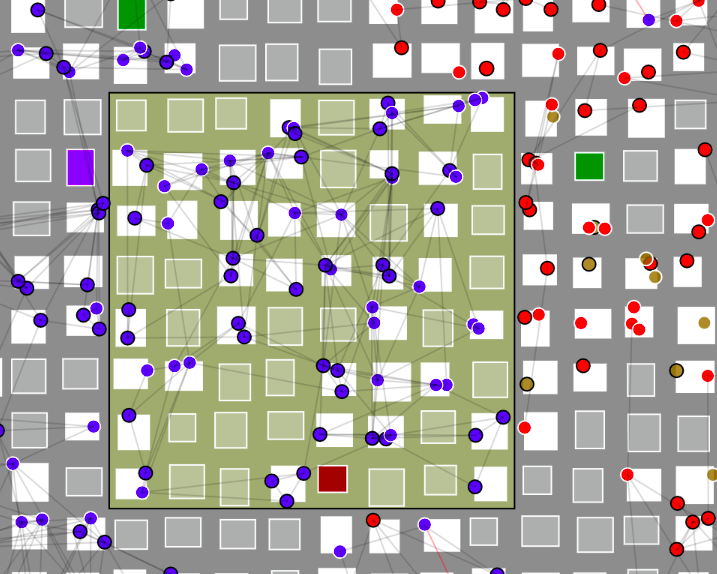
How to use the Simulation Environment
First click in the simulation environment to focus on it.
Press h,j,k,l to move around the bigger map (the one at the top) or click in the mini map
(which is also a heat map) to observe a different area. Press “I” or “O” to endorse
people to stay in their homes or go out. Click at two end points in the bigger
map to create a quarantine. Mouse over a certain house to inspect the state of
the residents (displayed in bottom right).
Introduction
In this blog post I attempt to model the spread and effects of a disease.
This is a very timely topic with the emergence of COVID-19. Being able to simulate the disease is invaluable, particularly when combined with the simulation of mitigation approaches.
Model
Personal Networks
Every person has a constant network (ego-network) of people they can potentially interact with. For example you
can think of this network as all the people you have interacted with in the last 100 days (or some other
time frame long enough so that the outcome of the disease have been determined). Denote the network of citizen
$u$ as $N_u$.
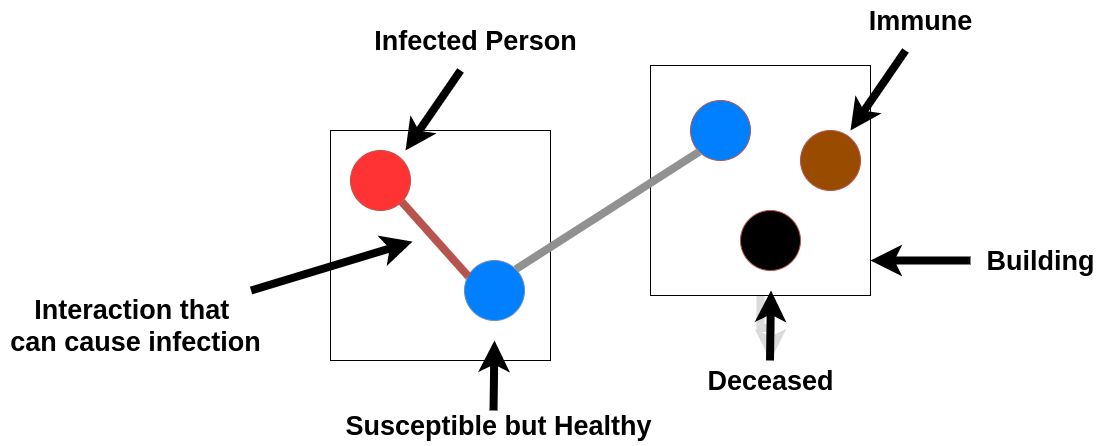
This model is household-based, i.e. we have families living in the same building (indicated with rectangles in the simulation above).
Individuals in the same house are naturally in the network of each other.
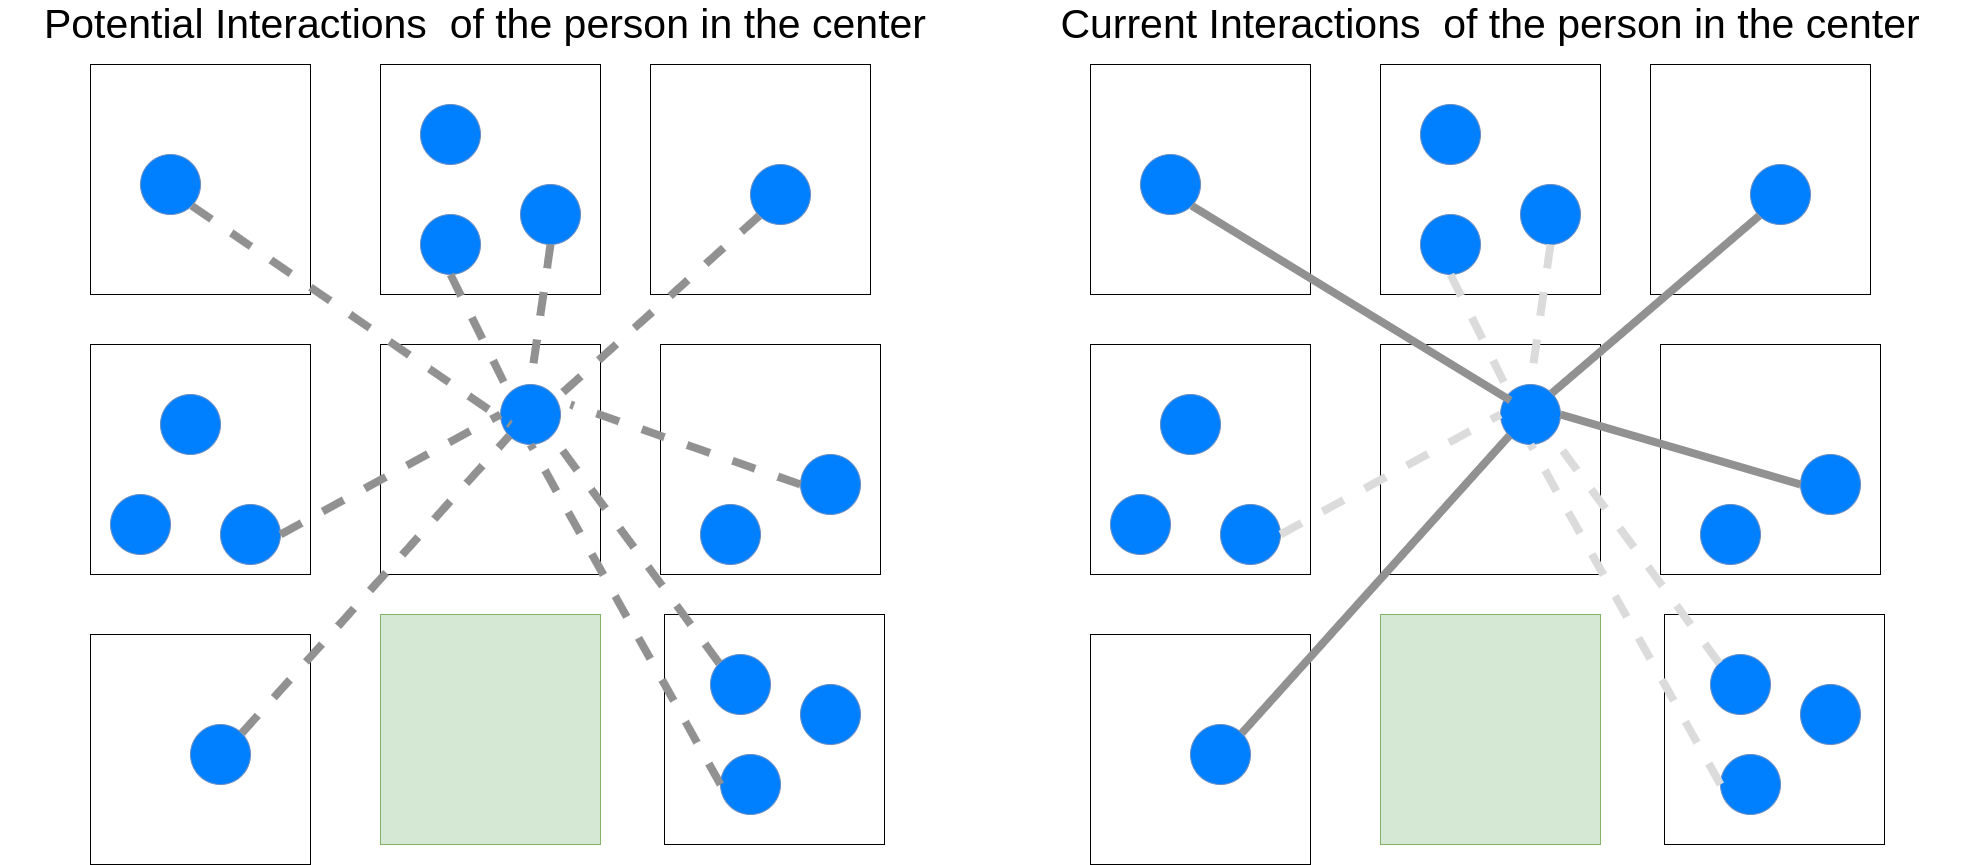
Interactions
After fixing $N_u$, we have a dynamic network of temporary interactions. For example the daily interactions of
a person. Denote this as $N_u(t) = \{ v : v \in N_u, v \text{ interacted with u at time t} \}$. To decide
if $u,v$ interacted with each other during, say, a day we consider a few parameters: If any of the two are sick with symptoms -
the severity of the symptoms, the social distancing parameter of the individual
which is based on a biased random walk, and whether the two individuals live in
the same building or not. The random walk can be adjusted
depending on the governmental guidelines, i.e. whether the government is urging
people to go out or stay at home (this is controlled by pressing “O” or “I”
respectively in the simulation environment).
Disease Evolution and Hospital capacity
Once a person gets infected, their disease evolves according to a simple
Markov Chain. Every person that gets infected starts with no symptoms.
Every passing day the person has a chance of transitioning to the state of having
symptoms. Similarly the disease can progress to other stages.
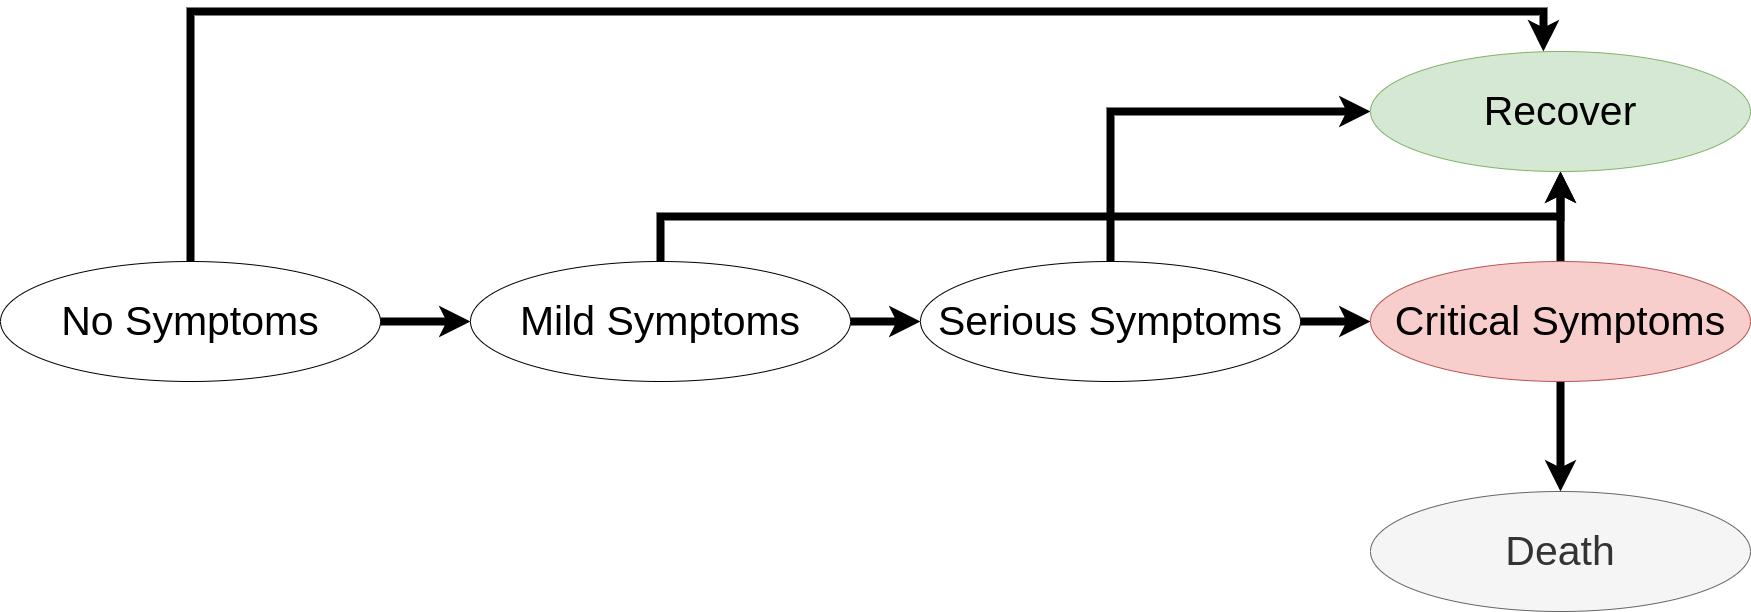
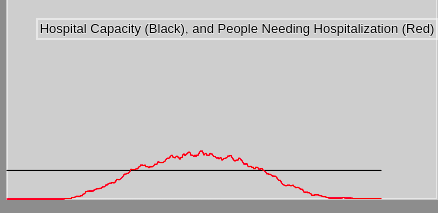
When an infected person reaches a critical condition it requires
hospitalization. If there is capacity the person is admitted to the hospital.
Otherwise they are not admitted, and their chance of passing away increases. As
you can see in the image below, in that case the hospital capacity was exceeded
for a brief period, resulting in certain people not getting treatment.
Quarantines
The user can click at two points succesively in order to place a quarantine
(rectangular in shape). People within the quarantine can not interact with
people outside. Possibly in a future version it will be explored if an automatic
quarantine scheme can lead to good control of the spread - relatively to some
penalty term that prevents the overuse of quarantines.